Studio
KPI evaluation
that powers AIR4D (AFI920).
Sensor-performance KPIs are computed and analyzed automatically across every dataset collected. It's the validation backbone that improves the next AIR4D quickly and consistently, and the same infrastructure is scalable for custom client collaborations and strategic partnerships.
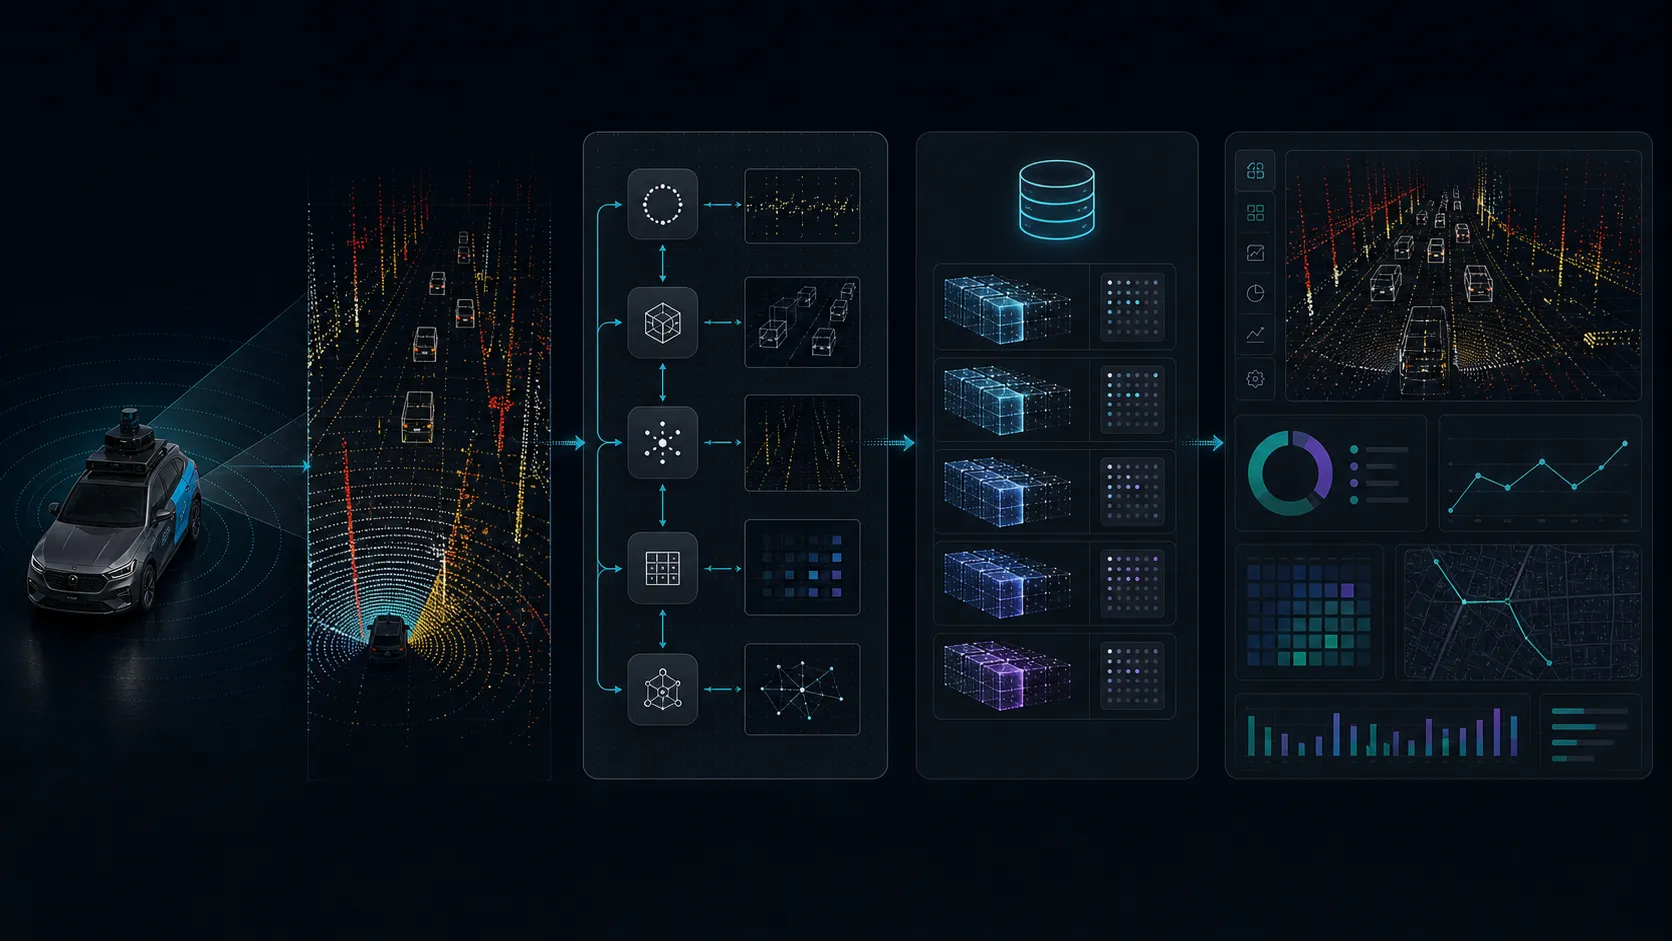
01 — Workflow
From collection to dashboard — end-to-end.
From data collection to the KPI dashboard, every stage is automated and standardized to run reproducibly.
Data Collection
RIDE vehicle real-world driving + multi-sensor capture (see the Drive page)
Data Refinement
capture → sync → calibration → format → meta · GT → QA
Dataset Publish
Dataset finalized · Dataset DB updated
Data View
Explore the finished dataset in the 3D Viewer (Scene · Clip · Frame)
Discovery & Custom Scenario
Search/explore/filter by ODD and metadata → update scenario sets or build a custom dataset
Scenario Dashboard
Scenario management dashboard — per-ODD/scenario data distribution and custom-dataset status
KPI Auto-Evaluation
Automatic computation of AIR4D sensor KPIs — point cloud · tracking, etc.
KPI Result Analysis
Detailed analysis by scenario · Clip · Frame · Object · regression comparison · drift detection
KPI Dashboard
KPI management dashboard — per-scenario composite KPIs · AIR4D version-over-version score trends · regression monitoring
02 — Features
Four capabilities, working together.
Studio is built from four capabilities — exploring the dataset, quantifying sensor performance, curating scenarios, and monitoring overall trends.
Dataset 3D Viewer
Explore Clip- and Frame-level data with rich metadata in the 3D Viewer. Synchronized Radar · LiDAR · Camera · GT overlay playback.
KPI Auto-Evaluation
Automatically compute AIR4D point-cloud and tracking KPIs, analyzed by scenario · Clip · Frame · Object.
Discovery & Scenario Curation
Search/filter by ODD and metadata to find data and build custom datasets, with per-scenario distribution managed on a dashboard.
KPI Dashboard
Monitor per-scenario composite KPIs, AIR4D version-over-version KPI score trends, and regression trends on one screen.
03 — Data Viewer
Explore every frame, every sensor stream.
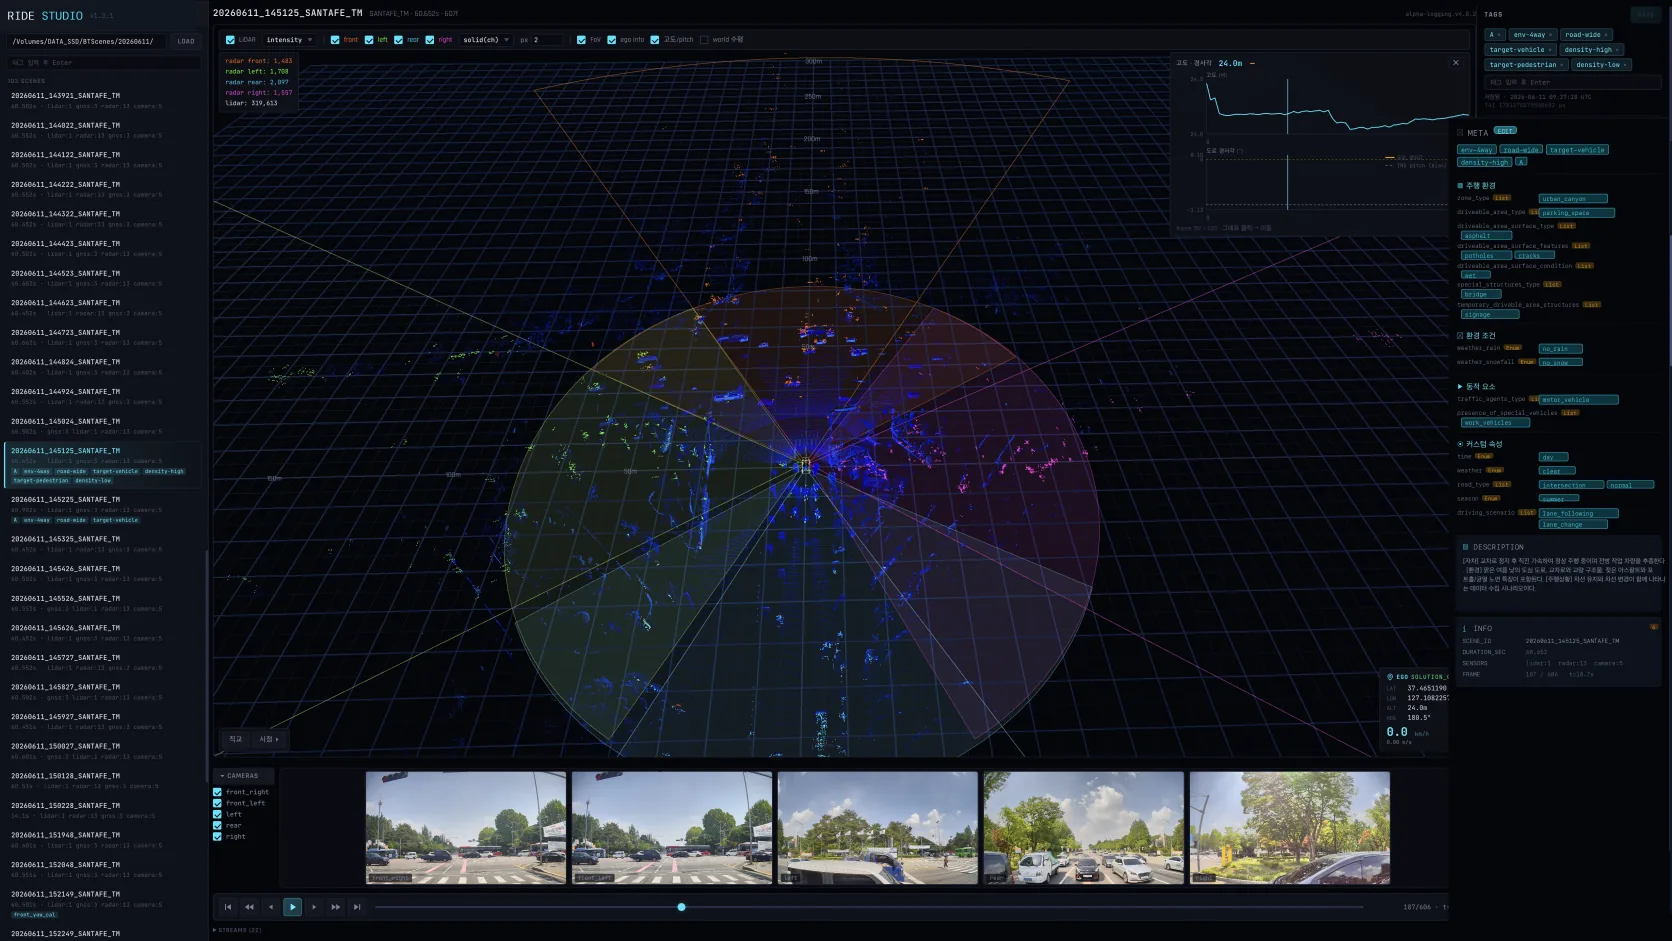
Explore the dataset's Clip and Frame units directly in the 3D Viewer. Play Radar · LiDAR · Camera · GT overlay in sync while reviewing rich metadata.
Highlights
- Scene meta — recording date · vehicle · ODD · start/end · frame count
- Per-sensor viewer — Camera frames · LiDAR PCD 3D · Radar scan/track
- Scan timeline — timestamp matching · gap visualization
- Perception overlay — object · lane · structure · INS · freespace
- Advanced 4D Radar analysis — Range-Doppler heatmap · beam/NCI heatmap
04 — KPI Analyzer
Quantify radar performance, end-to-end.
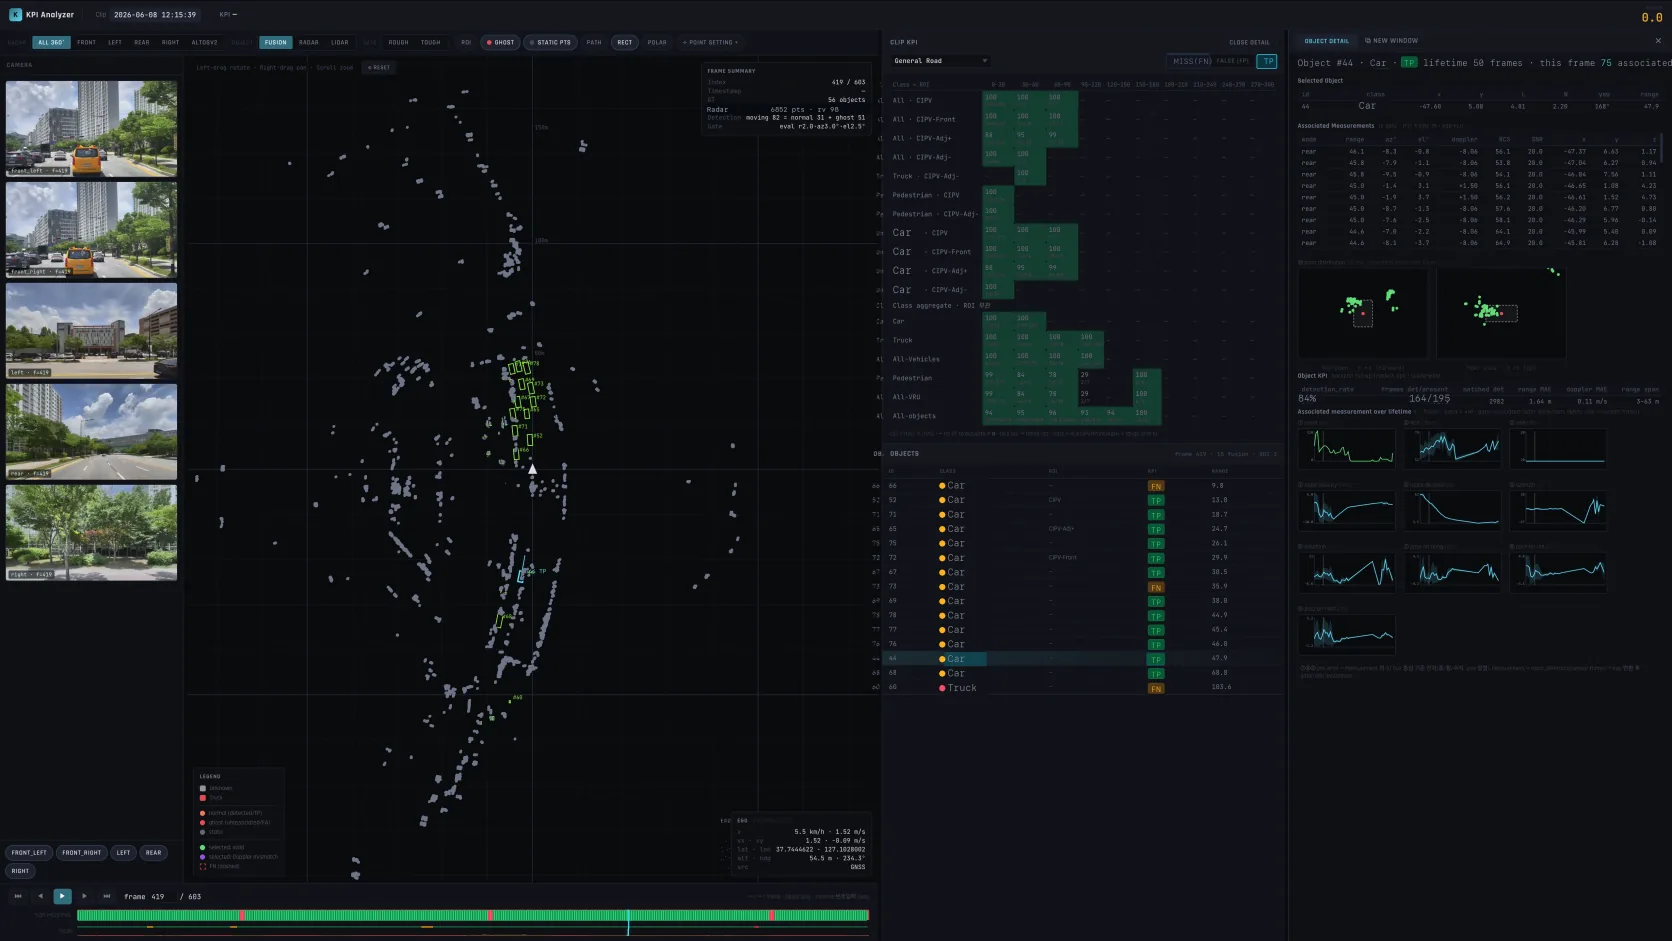
Automatically compute and analyze AIR4D sensor-performance KPIs by scenario · Clip · Frame · Object.
Highlights
- Object detection · tracking · bird's-eye-view (BEV) accuracy KPIs
- Recall · N_obj · Doppler MAE · Range MAE · per-scan Pass/Fail
- Regression comparison · drift detection · weak-subdomain flags
- Comparative analysis between the sensor-under-test (SUT) and the RIDE dataset's Ground Truth
05 — Discovery
Search the dataset, curate your own.
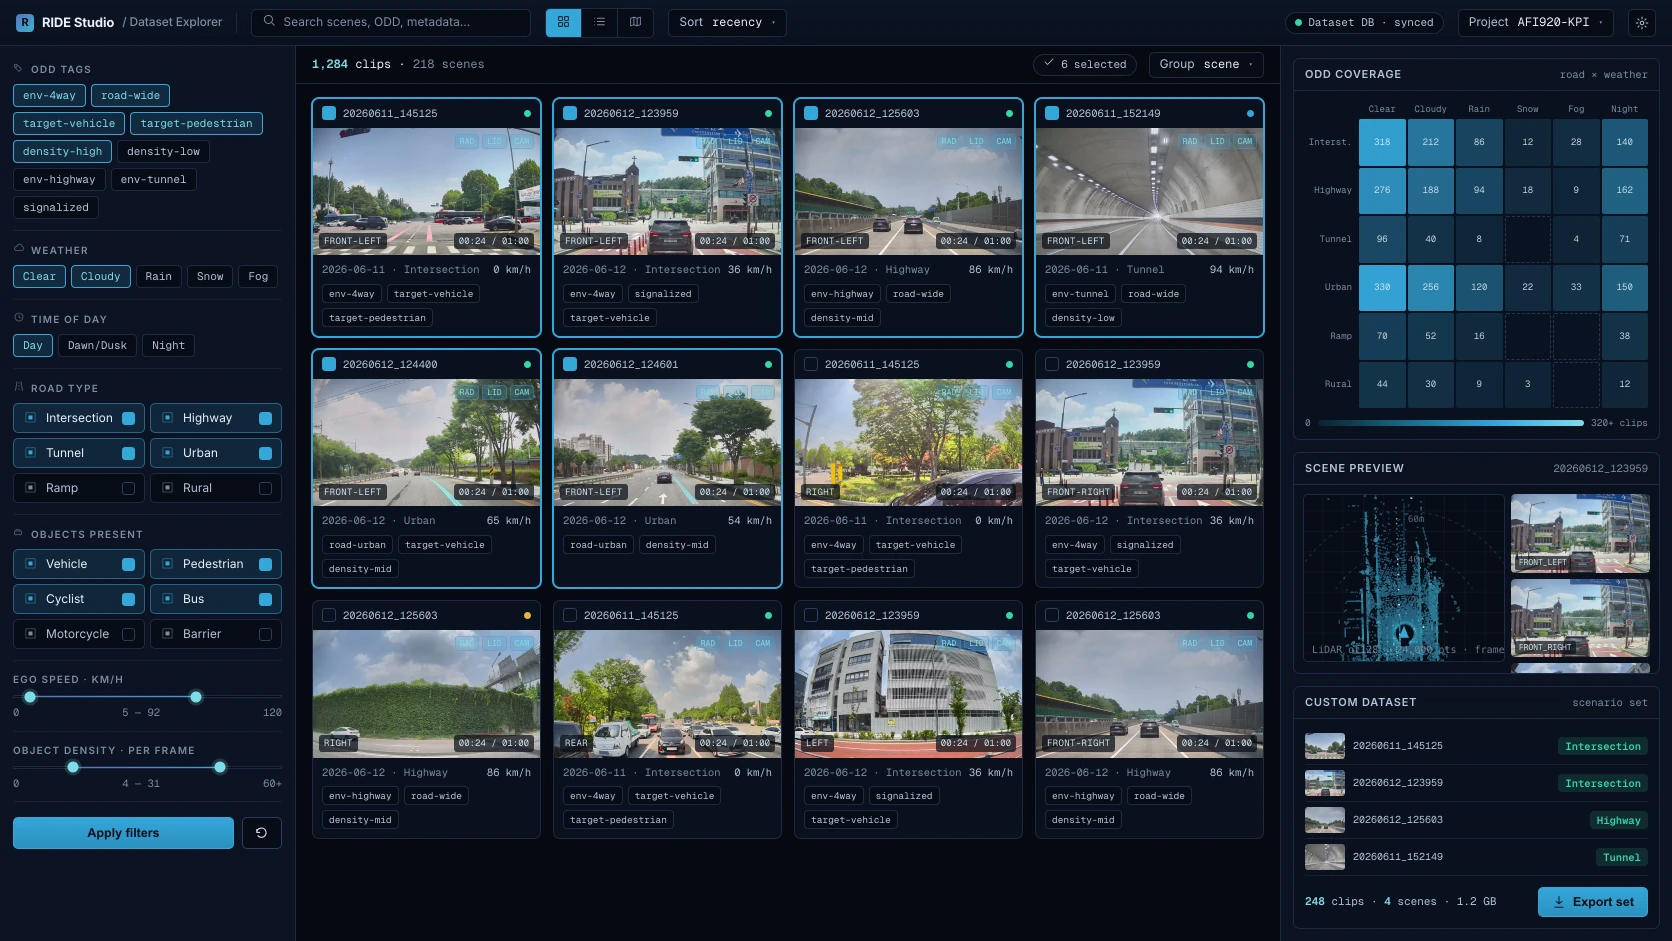
Search/filter by ODD and metadata to find data and build custom datasets, with per-scenario distribution managed on a dashboard.
Highlights
- Multi-filter search by ODD and metadata (weather · time of day · road type · objects)
- Clip/Frame-level result preview · instant 3D Viewer linking
- Build · save · export custom datasets (scenario sets)
- Per-scenario distribution · ODD coverage-matrix visualization
- Identify gap scenarios → link to additional-collection requests
06 — KPI Dashboard
Track KPI trends across every AIR4D version.
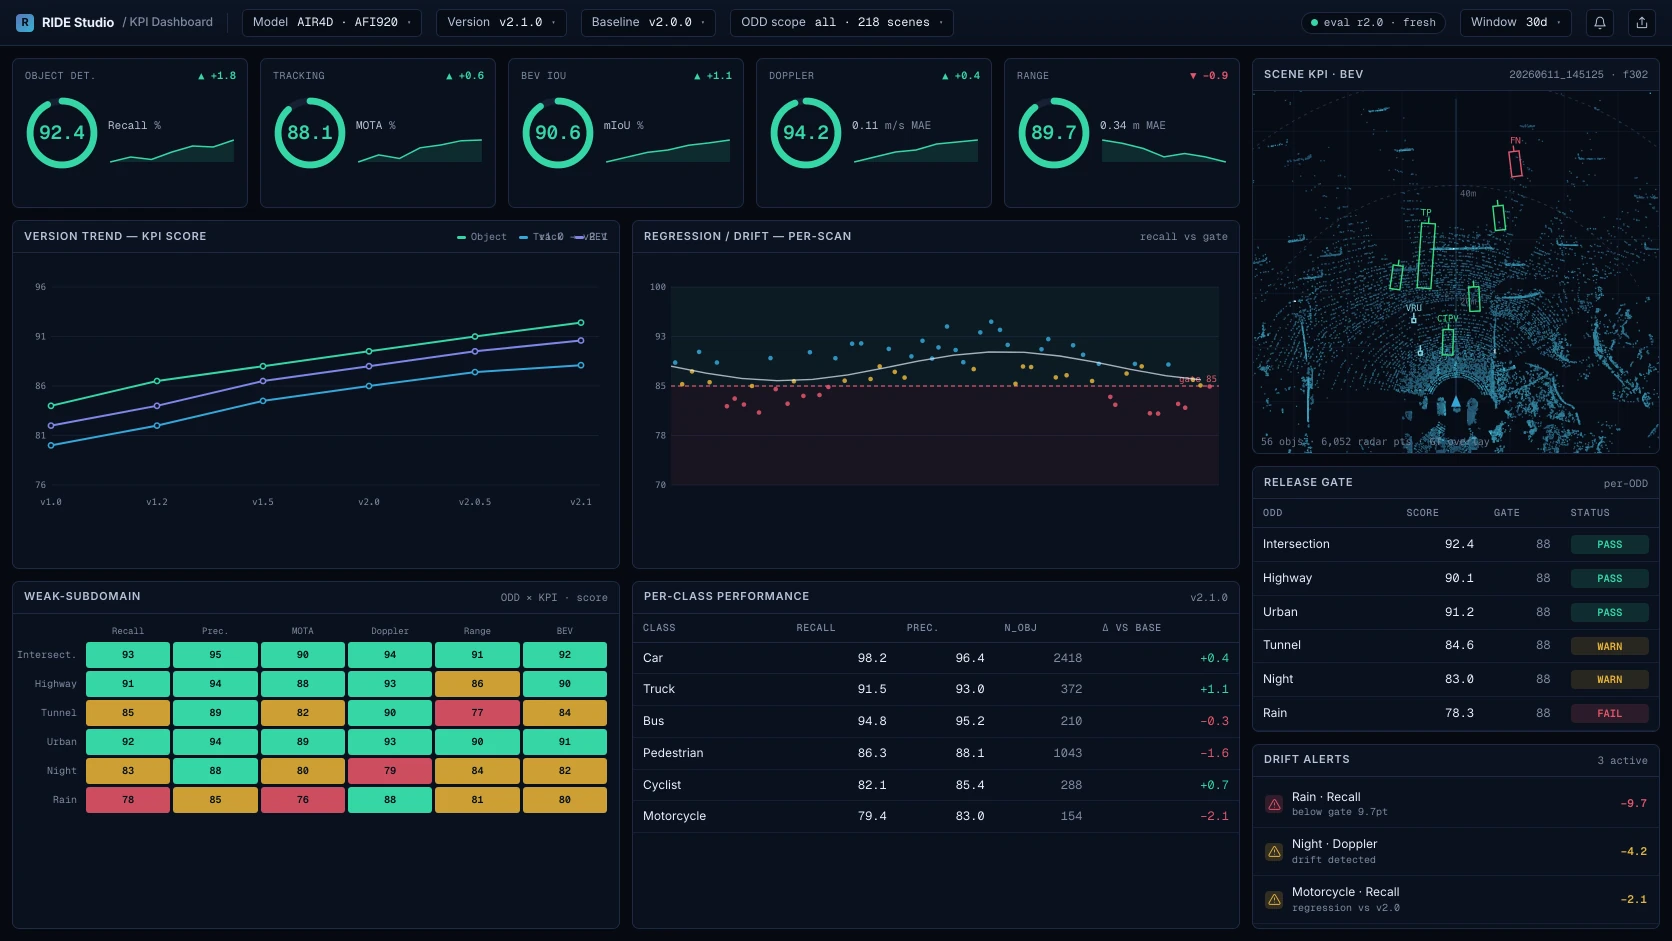
Monitor per-scenario composite KPIs and AIR4D version-over-version score trends on one screen, tracking regression and drift.
Highlights
- Per-scenario composite KPI scores — object · tracking · BEV
- AIR4D version-over-version KPI score trends
- Regression trends · drift alerts
- Per-ODD/scenario weak-subdomain heatmap
- Version comparison · release-gate metrics
07 — Collaboration
Where we collaborate.
Collaboration and partnerships built on the RIDE dataset and Studio's KPI infrastructure. Representative forms are below; if you have other needs, we'll explore them together.
AIR4D Performance Tuning
We support software optimization and configuration so AIR4D performs at its best in your operating environment and scenarios — including regional localization. The RIDE dataset and Studio KPI evaluation serve as the validation backbone.
Edge Case Curation
We rapidly curate the edge-case scenarios you need. Where coverage is short, we collect more with the RIDE vehicle and supply a tailored data package.
Sensor Model Fidelity
We provide real-measurement RIDE datasets to simulation-tool vendors to validate sensor-model fidelity and advance sim-based evaluation capabilities.
Custom KPI Development
We define and automate KPI metrics tailored to your perception stack and evaluation requirements, built on the RIDE dataset and Studio's KPI infrastructure.
Let's explore a collaboration.
Partnerships, custom datasets, or a separate effort built on this data and KPI infrastructure — whatever it is, let's talk.